admin

Bitcoin has become one of the most closely watched digital assets in the global financial market. Its price can change rapidly in response to investor sentiment, economic developments, institutional demand, regulatory decisions, and changes in cryptocurrency market liquidity. For traders and investors who want to understand these movements, Bitcoin technical analysis provides a structured way to study price charts, identify potential trends, and evaluate possible market scenarios.
Unlike fundamental analysis, which examines the underlying value of an asset and the factors affecting its adoption, technical analysis focuses primarily on historical price movements, trading volume, chart patterns, and mathematical indicators. By studying these elements, traders attempt to understand whether Bitcoin is experiencing bullish momentum, bearish pressure, or a period of consolidation.
In 2026, Bitcoin technical analysis remains an important research tool for people following the cryptocurrency market. However, successful analysis requires more than identifying a familiar chart pattern or relying on a single indicator. Traders must understand how different signals work together, recognize the limitations of historical data, and manage the uncertainty associated with Bitcoin’s volatility.
This comprehensive guide explains the essential concepts behind Bitcoin technical analysis, including support and resistance, candlestick patterns, moving averages, the Relative Strength Index (RSI), MACD, trading volume, and risk management. It also explores how traders can build a more disciplined approach to interpreting Bitcoin price movements without assuming that any indicator can predict the future with certainty.
What Is Bitcoin Technical Analysis?
Bitcoin technical analysis is the study of Bitcoin’s historical prices and trading activity to identify patterns that may provide clues about future market behavior. It is commonly used by short-term traders, swing traders, and longer-term investors who want to understand market direction before making decisions.
The basic principle is that price charts reflect the combined actions of buyers and sellers. When demand increases relative to available selling pressure, prices may rise. When selling pressure becomes stronger than buying demand, prices may decline. Technical analysts examine how these forces appear through price movements, volume changes, and chart structures.
How Technical Analysis Works
A Bitcoin price chart displays the asset’s movement over a selected period, such as five minutes, one hour, four hours, one day, or one week. Each timeframe reveals a different perspective on market behavior.
Shorter timeframes can help traders study intraday price fluctuations, while daily and weekly charts can provide a broader view of the market’s direction. A pattern that appears significant on a five-minute chart may have little importance when compared with a major trend on a weekly chart.
For this reason, experienced analysts often examine multiple timeframes rather than depending on one chart. They may use a weekly chart to understand the broader trend, a daily chart to identify important price zones, and a four-hour chart to study potential entry opportunities.
Why Bitcoin Technical Analysis Matters
Bitcoin operates continuously, unlike traditional stock exchanges that follow specific trading hours. This creates opportunities for price movements at any time of day, but it also means that market conditions can change quickly.
Technical analysis helps organize market information into a clearer framework. It can highlight areas where buyers previously entered the market, identify potential resistance zones, and show whether price momentum is strengthening or weakening.
Nevertheless, technical analysis does not guarantee profitable trades. Unexpected news, exchange disruptions, leveraged liquidations, and sudden changes in liquidity can invalidate an otherwise reasonable chart setup.
Bitcoin Price Charts
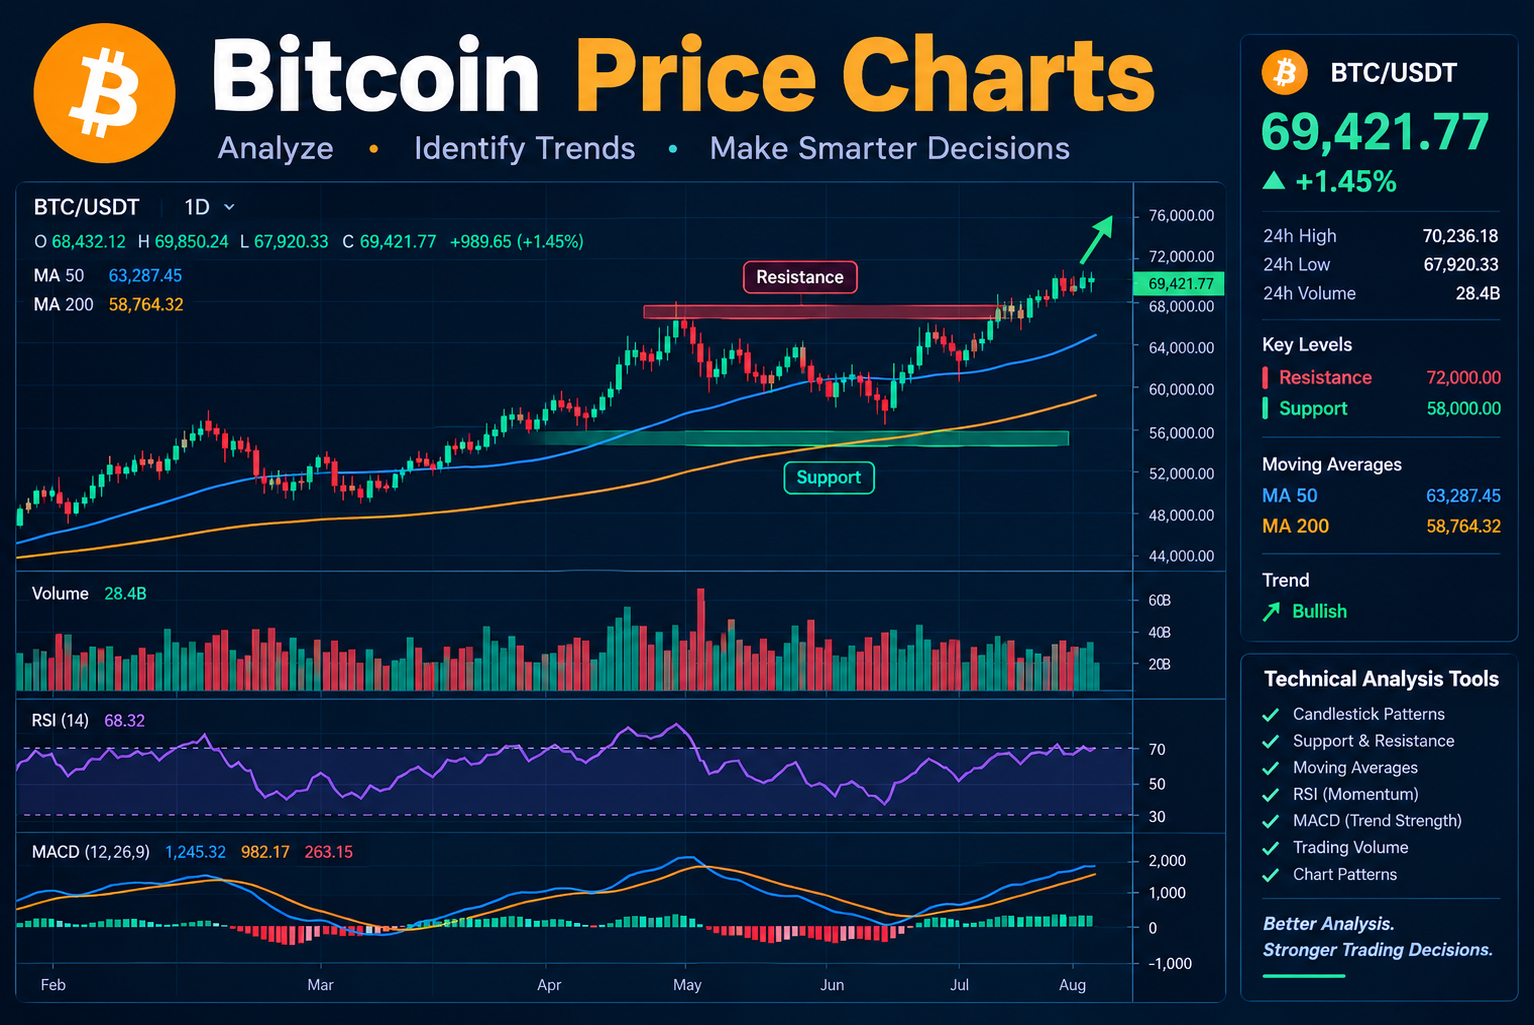
Price charts are the foundation of Bitcoin technical analysis. Learning how to interpret them allows traders to understand market behavior without becoming dependent on complicated indicators.
Candlestick Charts Explained
Candlestick charts are among the most widely used tools in cryptocurrency trading. Each candle represents price activity during a specific period and displays four important values: the opening price, closing price, highest price, and lowest price.
A bullish candle generally forms when Bitcoin closes above its opening price. A bearish candle generally forms when it closes below its opening price. The candle’s body shows the difference between opening and closing prices, while its wicks indicate the highest and lowest prices reached during that period.
Large bullish candles can indicate strong buying pressure, particularly when accompanied by increased volume. Large bearish candles may suggest aggressive selling. However, one candle should not be interpreted in isolation because the surrounding market structure can significantly change its meaning.
Common Candlestick Patterns
Several candlestick formations receive attention in Bitcoin technical analysis. A hammer may indicate that buyers have responded to lower prices after a decline. A shooting star may suggest that sellers rejected higher prices. Engulfing patterns occur when a candle’s body substantially covers the previous candle’s body and may indicate a shift in short-term momentum.
These patterns become more meaningful when they appear near established support or resistance zones. A bullish reversal pattern near support, for example, may provide stronger evidence of buying interest than the same pattern appearing in the middle of an unclear trading range.
Even then, confirmation matters. Traders may wait for a candle to close, examine volume, or look for a subsequent move before treating a pattern as a useful signal.
Support and Resistance in Bitcoin Trading
Support and resistance are among the most important concepts in Bitcoin technical analysis because they help traders identify price areas where buying or selling activity may become more significant.
What Is Bitcoin Support?
Support is a price area where buying interest has previously been strong enough to slow or stop a decline. When Bitcoin approaches this zone, some traders may consider buying, while short sellers may take profits.
Support is not an unbreakable price floor. If selling pressure overwhelms demand, Bitcoin can move below the zone and continue declining. A break below established support may also encourage additional selling if traders interpret it as evidence of weakening market conditions.
Analysts generally treat support as a zone rather than an exact price because markets rarely respond perfectly to a single numerical level.
What Is Bitcoin Resistance?
Resistance is a price area where selling pressure has previously slowed or stopped an advance. Traders who purchased at higher prices during an earlier decline may sell when the market returns to their entry levels. Other market participants may also use resistance as an area to take profits.
If Bitcoin breaks above resistance with convincing momentum and increased trading volume, the market may continue higher. In some cases, the former resistance zone can become a new support area when the price revisits it.
This process is often called a support and resistance flip. Traders monitor these retests to assess whether a breakout is holding or failing.
How to Identify Important Price Zones
Historical swing highs and swing lows are useful starting points for locating support and resistance. Other relevant areas include previous consolidation ranges, major moving averages, and levels where price has repeatedly changed direction.
The more consistently a zone has influenced price action, the more attention it may receive from market participants. However, repeated tests can sometimes weaken a level rather than strengthen it, particularly when buyers or sellers gradually exhaust their available orders.
Moving Averages and Bitcoin Trend Analysis
Moving averages smooth out price fluctuations and help traders identify the broader direction of the market. They are widely used in Bitcoin technical analysis because they make it easier to distinguish a developing trend from short-term noise.
Simple Moving Average
The Simple Moving Average (SMA) calculates the average closing price over a selected number of periods. For example, a 50-day SMA averages Bitcoin’s closing prices over the previous 50 daily candles.
When Bitcoin trades above a rising moving average, the market may be displaying a positive trend. When price remains below a declining moving average, the broader trend may be weaker. These observations are contextual signals rather than guarantees of future movement.
The 50-day and 200-day moving averages are particularly popular for examining medium-term and long-term market conditions.
Exponential Moving Average
The Exponential Moving Average (EMA) gives greater weight to recent prices, allowing it to react more quickly to new market movements than a comparable SMA.
Shorter EMAs can help traders study momentum, while longer EMAs may provide insight into the broader trend. For example, some traders examine the 20-day EMA alongside the 50-day EMA to assess whether short-term price strength is developing.
Because EMAs respond more quickly to price changes, they can also generate more false signals during sideways markets. Their usefulness depends on the timeframe, market conditions, and the trader’s overall strategy.
Golden Cross and Death Cross
A golden cross occurs when a shorter-term moving average crosses above a longer-term moving average. A death cross occurs when a shorter-term average crosses below a longer-term average.
These formations are commonly interpreted as potential bullish and bearish trend signals, respectively. However, moving averages are lagging indicators, meaning that the crossover generally reflects price movements that have already occurred.
Traders should therefore evaluate these signals alongside market structure, trading volume, and broader economic conditions rather than treating them as standalone predictions.
RSI: Measuring Bitcoin Market Momentum
The Relative Strength Index, commonly known as RSI, is a momentum indicator that measures the speed and magnitude of recent price changes. It typically ranges from 0 to 100 and is frequently used to evaluate whether an asset may be overbought or oversold.
Understanding RSI Levels
An RSI reading above 70 is traditionally considered overbought, while a reading below 30 is traditionally considered oversold. These thresholds are widely recognized, but they do not automatically signal an imminent reversal.
During a strong Bitcoin uptrend, RSI can remain elevated for an extended period. During a persistent downtrend, it can remain depressed. Selling simply because RSI crosses 70 or buying solely because it falls below 30 can therefore produce poor results.
Traders often use RSI to evaluate momentum within the broader market trend. They may also examine whether RSI confirms a breakout or begins weakening while the price continues moving higher.
RSI Divergence
Bullish divergence can occur when Bitcoin creates a lower price low while RSI forms a higher low. This may suggest that downward momentum is weakening.
Bearish divergence can occur when Bitcoin creates a higher price high while RSI forms a lower high. This may indicate that upward momentum is losing strength.
Divergence is not a reliable reversal signal on its own. It can persist through multiple price movements, so traders generally look for confirmation from price action, support and resistance, or other indicators before drawing conclusions.
MACD Indicator for Bitcoin Technical Analysis
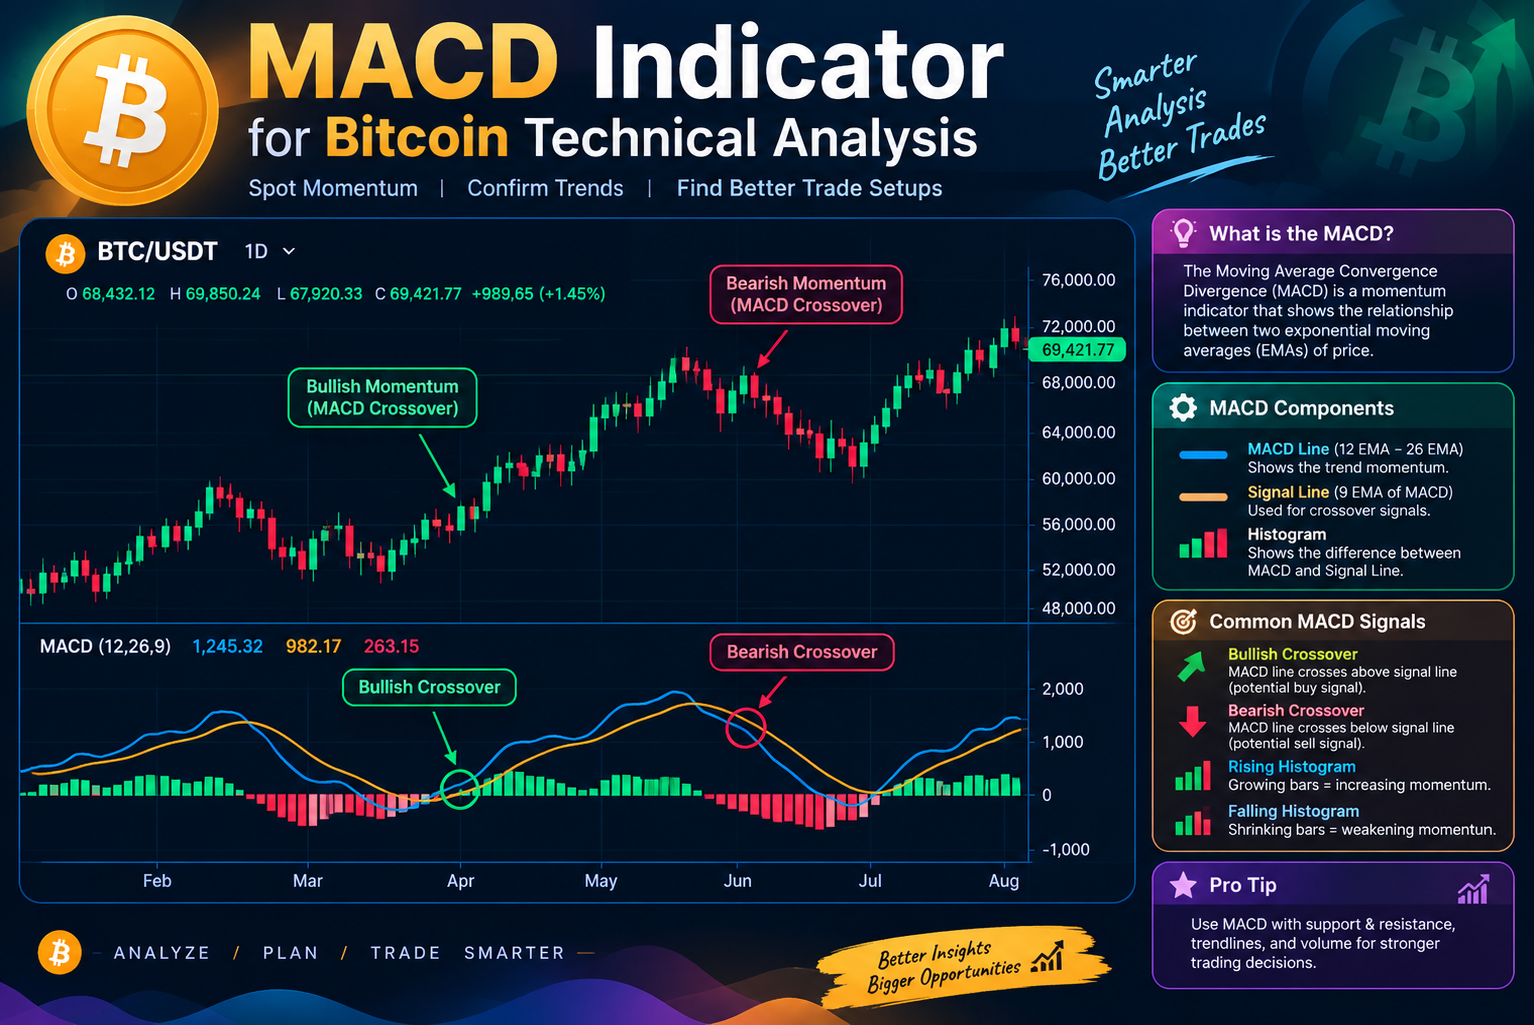
The Moving Average Convergence Divergence indicator, known as MACD, helps traders examine changes in momentum and trend direction. It is calculated using the relationship between two exponential moving averages and is commonly displayed with a signal line and histogram.
How MACD Signals Work
When the MACD line crosses above its signal line, traders may interpret the movement as a potential bullish momentum signal. A cross below the signal line may indicate weakening momentum or possible bearish pressure.
The MACD histogram illustrates the difference between the MACD line and its signal line. Expanding histogram bars may indicate increasing momentum, while shrinking bars can suggest that momentum is slowing.
However, MACD signals can be delayed, particularly when Bitcoin has already made a substantial move. In sideways conditions, repeated crossovers can also create misleading signals.
Combining MACD With Other Indicators
MACD can be more useful when evaluated alongside support and resistance or moving averages. For example, a bullish MACD crossover near a support zone may attract attention if Bitcoin is also forming higher lows.
Conversely, a bearish crossover near established resistance may support a cautious interpretation of the market. Neither setup confirms what will happen next, but combining independent pieces of evidence can help traders develop a more structured analysis.
Trading Volume and Bitcoin Breakouts
Trading volume measures how much Bitcoin changes hands during a particular period. It provides important context because a price movement accompanied by strong trading activity may reflect broader participation than a similar move occurring on unusually low volume.
Why Volume Matters
When Bitcoin rises above a resistance zone while trading volume increases, analysts may view the breakout as more convincing. Higher participation can suggest that the move has attracted interest from a wider range of traders.
If Bitcoin breaks above resistance on weak volume, the breakout may be more vulnerable to failure. Nevertheless, volume should not be treated as definitive proof because exchange coverage, market fragmentation, and differences between data providers can affect reported figures.
Recognizing Breakout and Breakdown Signals
A breakout occurs when Bitcoin moves above an established resistance area. A breakdown occurs when price falls below a recognized support zone.
Traders may look for a decisive candle close, increased volume, and a successful retest to evaluate whether the move is holding. A retest happens when price returns to the broken level after the initial move.
If former resistance acts as support during a retest, the breakout may be gaining credibility. If Bitcoin quickly falls back into its previous trading range, the move may represent a false breakout, sometimes called a bull trap when buyers are caught in a failed upward move.
The same principle applies in reverse to breakdowns and potential bear traps.
Bitcoin Chart Patterns Traders Should Know
Chart patterns help traders interpret the structure of price movements. They are not guarantees, but they can provide a framework for comparing current conditions with historically observed formations.
Head and Shoulders
A head-and-shoulders pattern consists of three peaks, with the middle peak higher than the two surrounding peaks. A neckline connects important lows between the peaks.
A confirmed break below the neckline is traditionally interpreted as a possible bearish signal. An inverse head-and-shoulders pattern has a similar structure upside down and may indicate a potential bullish reversal if price breaks above its neckline.
The pattern is more useful when the structure is clear and the breakout is supported by other evidence.
Double Tops and Double Bottoms
A double top occurs when Bitcoin approaches a similar high twice but fails to establish a sustained advance. It may suggest that resistance is limiting buying momentum.
A double bottom occurs when price tests a similar low twice and subsequently begins moving higher. Traders may interpret this as evidence that demand is emerging near support.
Neither pattern is confirmed merely because two peaks or lows look similar. The subsequent price movement, relevant confirmation level, and broader trend all matter.
Triangles and Consolidation Patterns
Ascending triangles typically feature relatively flat resistance and rising lows. Descending triangles generally feature relatively flat support and declining highs. Symmetrical triangles form when highs decline and lows rise toward a narrowing range.
These structures indicate consolidation, but the eventual direction is not guaranteed. Bitcoin can break out in either direction, making it important to wait for evidence rather than assuming that a particular shape determines the next move.
Bitcoin Technical Analysis Across Different Timeframes
The selected timeframe can significantly change how a chart should be interpreted. A useful Bitcoin technical analysis process distinguishes between the broader market trend and shorter-term price fluctuations.
Short-Term Trading
Day traders often study five-minute, 15-minute, one-hour, or four-hour charts. These timeframes can help identify short-term momentum, intraday support zones, and potential breakout setups.
However, short-term charts contain considerable noise. Trading fees, spreads, sudden volatility, and emotional decisions can undermine an otherwise reasonable strategy. A clear entry signal does not remove the risks associated with frequent trading.
Swing Trading
Swing traders usually seek to benefit from price movements that develop over several days or weeks. They often combine four-hour and daily charts to identify trend direction, consolidation areas, and potential reversal zones.
This approach may reduce the need to respond to every small price movement, although it still requires a defined risk limit and a willingness to accept losses when the market moves against the trade.
Long-Term Trend Analysis
Long-term investors may focus on weekly and monthly charts. These timeframes can help reveal major market cycles, extended support zones, and sustained changes in price structure.
A temporary decline on a daily chart may appear less significant within a longer-term uptrend. Conversely, several weeks of weakness can be easier to recognize when the broader chart is examined rather than focusing exclusively on short-term price action.
How Bitcoin News and Market Sentiment Affect Technical Signals
Technical analysis studies price behavior, but Bitcoin prices are also influenced by information that can rapidly change market expectations.
Central bank decisions, inflation reports, regulatory announcements, institutional investment flows, exchange security incidents, and major changes in cryptocurrency demand can all influence price movements.
For example, Bitcoin may break above a resistance zone as buyers respond to positive market news. However, an unexpected announcement can reverse that move before a technical setup develops as expected.
Market sentiment also matters. During periods of strong optimism, traders may be more willing to buy breakouts. During periods of fear, they may sell quickly when support levels fail.
Some analysts supplement chart analysis with derivatives funding rates, open interest, liquidation data, and spot-market activity. These measures can provide additional context, but they have their own limitations and should not replace a clear understanding of price action.
The most balanced approach combines technical evidence with awareness of major market developments. No chart pattern can fully account for every unexpected event.
Risk Management in Bitcoin Trading
Risk management is essential because even a carefully researched Bitcoin trade can lose money. Technical analysis helps traders identify possible opportunities, but it cannot eliminate uncertainty.
Setting Stop-Loss Levels
A stop-loss is an order or predefined exit level intended to limit a trade’s potential loss. Traders may position a stop beyond a relevant support or resistance zone, depending on whether they are trading a bullish or bearish setup.
A stop placed too close to the entry may be triggered by ordinary market fluctuations. A stop placed too far away may expose the trader to a larger loss than intended. The appropriate placement depends on volatility, strategy, and position size.
Stop orders also cannot guarantee an exact execution price during sharp price movements or periods of limited liquidity.
Understanding Position Sizing
Position sizing determines how much capital is allocated to a particular trade. Traders can estimate a suitable position size by considering the distance between the entry price and the planned stop-loss level.
For example, a trader willing to risk a small, predetermined portion of their trading capital can adjust the position size so that a stop-loss hit remains within that limit under normal execution conditions.
This approach encourages consistency rather than allowing confidence in a particular Bitcoin technical analysis signal to determine how much money is placed at risk.
Avoiding Excessive Leverage
Leverage allows traders to control a larger position than their initial margin would otherwise permit. Although it can magnify gains, it also magnifies losses and increases the risk of liquidation.
Bitcoin’s rapid price movements make high leverage particularly dangerous. A relatively small adverse move can result in substantial losses, even if the market later returns to the trader’s original direction.
Using little or no leverage, avoiding money needed for essential expenses, and maintaining a written trading plan can help reduce avoidable risks.
Common Bitcoin Technical Analysis Mistakes
One common mistake is relying on a single indicator. RSI may suggest overbought conditions while the broader trend remains strong, and a moving-average crossover may appear after much of a price movement has already occurred. Signals should be evaluated in context.
Another mistake is treating support and resistance as exact prices that must hold. Markets can move temporarily beyond important levels, and stop orders may be triggered before prices reverse. Thinking in terms of zones can provide a more realistic framework.
Emotional decision-making is another major challenge. Traders sometimes enter positions after a large rally because they fear missing out, or they sell during a sudden decline without checking whether the original trading plan has changed. A consistent process can help limit these reactions.
Finally, past performance should not be mistaken for proof of future results. A chart pattern that worked several times may fail under different liquidity conditions or during a major news event. Testing strategies across different market environments and accounting for fees can provide a more realistic assessment of their usefulness.
How to Build a Bitcoin Technical Analysis Strategy
A structured strategy begins by defining the objective. A trader should decide whether the goal is to study long-term trends, identify swing trades, or evaluate short-term price movements. This choice determines which timeframes and indicators are most relevant.
The next step is to assess market structure. Identify whether Bitcoin is forming higher highs and higher lows, lower highs and lower lows, or moving sideways within a range. Then mark the most relevant support and resistance zones.
After establishing the market context, select a small number of indicators that serve different purposes. Moving averages can help identify the trend, RSI can assess momentum, and volume can provide context for a breakout. Adding too many overlapping indicators may create confusion rather than improve the analysis.
Before entering a trade, determine what evidence would support the idea, what would invalidate it, and how much capital could be lost if the trade fails. Recording these decisions in a trading journal can help reveal whether a strategy is being applied consistently.
Historical testing and paper trading can also help evaluate a method before real money is committed. Results should account for trading fees, slippage, and the possibility that market behavior will change.
Most importantly, a strategy should be treated as a framework for managing uncertainty rather than a system that guarantees profits.
The Future of Bitcoin Technical Analysis in 2026
Bitcoin technical analysis is likely to remain relevant as cryptocurrency markets continue to develop. Institutional participation, increasingly sophisticated trading tools, derivatives markets, and improved charting platforms provide traders with more information than ever before.
At the same time, greater access to data does not automatically produce better decisions. Algorithms can react rapidly to market conditions, while leverage and automated liquidations can amplify price movements. Traders must distinguish useful evidence from indicators that merely repeat information already reflected in the price.
Artificial intelligence and automated charting tools may help identify patterns, compare historical scenarios, and organize market data. However, these systems depend on the quality of their inputs and assumptions. They can generate false signals, overlook unusual events, or perform poorly when market conditions change.
For anyone following Bitcoin in 2026, the strongest approach is to combine reliable chart data, a consistent analytical process, sensible risk management, and an understanding of the broader economic environment. Adaptability is more valuable than assuming that one indicator or pattern will always work.
Conclusion
Bitcoin technical analysis provides a practical framework for understanding cryptocurrency price movements, identifying potential trends, and evaluating trading opportunities. By learning how candlestick charts, support and resistance, moving averages, RSI, MACD, volume, and chart patterns work together, traders can develop a clearer picture of market behavior.
However, no indicator or chart formation can predict Bitcoin’s price with certainty. Market volatility, unexpected news, liquidity changes, and emotional decision-making can all influence results. Technical analysis is most useful when it supports a disciplined process rather than replacing critical thinking.
Whether someone is a beginner learning to read charts or an experienced Bitcoin Technical Analysis tradar refining an existing strategy, the essential principles remain the same: understand the market structure, wait for evidence, define risk before entering a position, and evaluate results objectively.