admin

Bitcoin Technical Analysis
Bitcoin technical analysis is an important Bitcoin Technical Analysis method for understanding cryptocurrency price movements, identifying market trends, and evaluating potential trading opportunities. As Bitcoin continues to attract retail traders, institutional investors, and long-term holders, understanding how to read BTC price charts can help market participants make more informed decisions.
Unlike fundamental analysis, which examines factors such as adoption, regulations, institutional investment, and economic conditions, Bitcoin technical analysis focuses primarily on historical price action, trading volume, momentum indicators, and chart patterns. Traders use these tools to evaluate whether buyers or sellers appear to have greater control over the market.
The Bitcoin market operates around the clock, allowing prices to change at any time. News announcements, interest-rate expectations, exchange-traded fund flows, leveraged trading, and investor sentiment can all contribute to sudden price fluctuations. Technical analysis helps organize this information into recognizable patterns, but it cannot predict future prices with certainty.
For anyone following BTC price analysis, learning about support and resistance, trendlines, moving averages, the Relative Strength Index (RSI), and the Moving Average Convergence Divergence (MACD) can provide a useful foundation. These indicators are most effective when interpreted together rather than treated as independent signals.
This guide explains how Bitcoin technical analysis works, which indicators traders commonly use, how to identify bullish and bearish market conditions, and why risk management remains essential in cryptocurrency trading.
What Is Bitcoin Technical Analysis?
Bitcoin technical analysis is the study of BTC price charts and market data to evaluate possible future price movements. The underlying idea is that historical price behavior, market momentum, and trading activity can provide clues about current market conditions.
Technical analysts examine patterns that develop as buyers and sellers interact. When demand increases, Bitcoin may establish higher highs and higher lows. When selling pressure becomes dominant, the market may form lower highs and lower lows. These structures help traders assess whether the market is trending upward, trending downward, or moving sideways.
However, chart patterns do not always produce the expected outcome. Bitcoin can reverse direction after an unexpected announcement, a large liquidation event, or a sudden change in global financial conditions. Technical analysis should therefore be treated as a framework for evaluating probabilities, not as a guaranteed forecasting method.
How BTC Price Charts Work
A Bitcoin price chart displays the market price over a selected period. Traders can analyze short timeframes, such as five-minute or hourly charts, or longer timeframes, such as daily and weekly charts.
Short-term charts are commonly used by active traders looking for intraday opportunities. Daily charts help identify broader market structures, while weekly charts can provide additional context for long-term investors.
Candlestick charts are among the most widely used formats. Each candle represents price activity during a particular period and displays the opening price, closing price, highest price, and lowest price.
A candle that closes above its opening price is generally considered bullish for that period, while a candle that closes below its opening price is generally considered bearish. The size of the candle body and its upper and lower wicks can provide additional information about momentum and price rejection.
Why Trading Volume Matters
Bitcoin trading volume measures how much BTC or associated trading value changes hands during a specified period, depending on the data source. Volume helps analysts evaluate the strength behind a price movement.
A breakout above resistance accompanied by increasing spot trading volume may provide stronger evidence of demand than a breakout occurring during unusually quiet trading. Similarly, a decline accompanied by rising volume can suggest increased selling pressure.
Volume should still be interpreted carefully. Different exchanges report different activity levels, and some markets may have lower liquidity than others. Derivatives volume and spot volume also represent different forms of trading activity.
Bitcoin Support and Resistance Levels
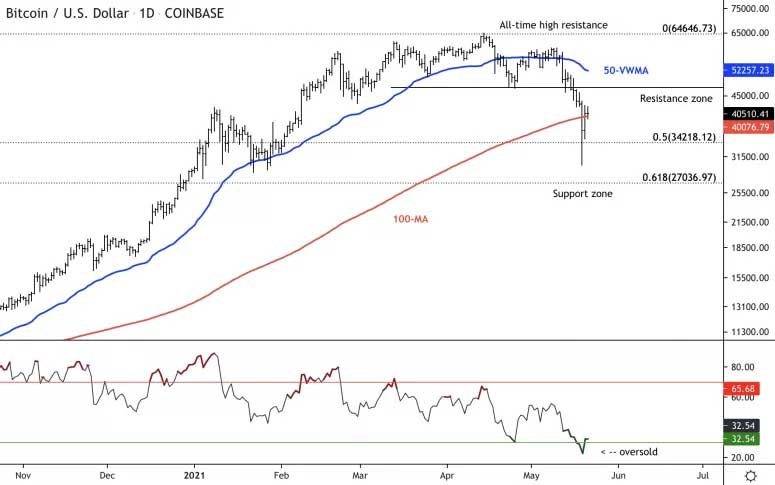
Support and resistance are fundamental concepts in Bitcoin price analysis. They identify price areas where buying or selling activity has previously influenced the market.
Support is a price zone where demand may increase enough to slow or temporarily reverse a decline. Resistance is a zone where selling pressure may limit an advance.
These levels are not fixed barriers. Bitcoin can move below support or above resistance when market conditions change. For this reason, traders often examine price reactions, volume, and candle closes instead of relying on a single price point.
How to Identify Bitcoin Support
Support can develop near previous market lows, consolidation zones, or areas where buyers have repeatedly entered the market. Traders may draw horizontal lines around these areas to identify possible locations where demand could return.
For example, if Bitcoin declines toward a previous low and then rebounds several times, that price region may be considered a potential support zone. A successful rebound does not guarantee that the level will hold in the future.
If Bitcoin closes below an established support area and continues falling, traders may interpret the move as a sign of weakening demand. The former support zone could then become resistance during a later recovery.
How to Identify Bitcoin Resistance
Resistance often develops near previous highs or areas where selling pressure has repeatedly emerged. Traders monitor these zones because a strong move above resistance may indicate that buyers are becoming more aggressive.
A breakout is generally more convincing when Bitcoin closes above the resistance zone, trading activity supports the move, and the price remains above the broken level. Some traders wait for a retest before considering an entry.
A false breakout occurs when Bitcoin moves above resistance but quickly falls back below it. False breakouts are particularly important in volatile markets because they can trap traders who enter positions too early.
Bitcoin Trend Analysis: Bullish, Bearish, and Sideways Markets
Trend analysis helps traders understand the general direction of Bitcoin’s price. Recognizing the prevailing trend can provide context for interpreting other technical indicators.
Bullish Bitcoin Trends
A bullish trend typically features a sequence of higher highs and higher lows. This pattern suggests that buyers are willing to purchase Bitcoin at progressively higher prices, while pullbacks find support above previous lows.
Traders may look for price movement above resistance, improving momentum, and rising spot volume to confirm that a bullish trend remains active.
Nevertheless, a rising market can experience sharp corrections. A bullish structure does not eliminate the possibility of temporary declines or a complete trend reversal.
Bearish Bitcoin Trends
A bearish trend commonly features lower highs and lower lows. This structure indicates that sellers are gaining control and that buying demand may be insufficient to sustain previous price levels.
Bitcoin may also show bearish signals when it repeatedly fails to break resistance or loses an important support zone. Weak momentum and increasing selling volume can provide additional context.
Traders should avoid assuming that a falling market must continue indefinitely. Short-covering rallies, changes in investor sentiment, and unexpected positive developments can trigger strong recoveries.
Sideways Bitcoin Markets
A sideways market develops when Bitcoin trades within a relatively defined range without establishing a clear upward or downward trend.
During consolidation, traders may identify the upper boundary as resistance and the lower boundary as support. Some strategies attempt to trade these boundaries, while others wait for a confirmed breakout.
Sideways markets can produce misleading signals because prices frequently move toward the edges of the range before reversing. A breakout may also fail, making confirmation and risk management especially important.
Best Technical Indicators for Bitcoin Analysis
Technical indicators use historical market data to summarize price direction, momentum, volatility, or trading activity. No indicator is accurate in every market environment, so traders often combine several tools to reduce reliance on a single signal.
Moving Averages
Moving averages smooth price data over a selected period to help identify the broader direction of the market. The Simple Moving Average (SMA) calculates the average price across a defined number of periods, while the Exponential Moving Average (EMA) gives greater weight to more recent prices.
The 50-day and 200-day moving averages are commonly watched in Bitcoin analysis. Traders may interpret price movement above a rising moving average as evidence of strength, while a declining price below a falling average can indicate weakness.
A moving average crossover occurs when a shorter-term moving average crosses a longer-term moving average. Some traders use these crossovers to identify potential trend changes, but signals can arrive late or generate false entries during sideways markets.
Relative Strength Index (RSI)
The Relative Strength Index, commonly called RSI, is a momentum indicator that ranges from 0 to 100.
An RSI reading above 70 is traditionally described as overbought, while a reading below 30 is often described as oversold. These thresholds are guidelines rather than automatic trading signals.
In a strong bullish trend, Bitcoin’s RSI can remain elevated for an extended period. Similarly, an oversold reading during a severe decline does not necessarily mean that the price will recover immediately.
Traders may also examine RSI divergence. Bullish divergence can occur when the price forms a lower low while RSI forms a higher low, suggesting that downward momentum may be weakening. Bearish divergence can occur when the price forms a higher high while RSI forms a lower high.
Divergence can persist without a reversal, so confirmation from price action is important.
Moving Average Convergence Divergence (MACD)
The MACD indicator evaluates the relationship between two exponential moving averages. It includes a MACD line, a signal line, and a histogram that illustrates the difference between the two lines.
When the MACD line crosses above the signal line, traders may interpret the event as a potential bullish momentum signal. A downward crossover may indicate weakening momentum.
MACD can help confirm a trend, especially when its signals align with price structure and trading volume. However, it is a lagging indicator because it is calculated from historical prices.
Bollinger Bands
Bollinger Bands consist of a moving average and two bands positioned using standard deviations of price. They expand when volatility increases and contract when volatility decreases.
Bitcoin traders sometimes monitor a narrowing band structure, known as a squeeze, because it indicates relatively low volatility. A squeeze may precede a larger move, but it does not reveal whether the eventual breakout will be upward or downward.
A price touching the upper band does not automatically mean Bitcoin is overbought, and a touch of the lower band does not guarantee a rebound. The surrounding trend and momentum are important.
Bitcoin Breakout Analysis and Chart Patterns

Chart patterns describe recurring price structures that traders use to evaluate possible continuation or reversal scenarios. These formations can help organize a trading plan, although interpretations may differ between analysts.
Head and Shoulders Pattern
The head and shoulders pattern consists of three peaks, with the middle peak higher than the other two. A neckline connects important lows between the peaks.
A break below the neckline may indicate a potential bearish reversal. The inverse head and shoulders pattern has the opposite structure and may indicate a possible bullish reversal when price breaks above its neckline.
Neither pattern guarantees a particular price target or outcome. Traders typically seek confirmation from volume, the broader trend, and subsequent price behavior.
Double Top and Double Bottom
A double top develops when Bitcoin approaches a similar resistance area twice and fails to move decisively higher. A break below the intervening low may indicate weakening demand.
A double bottom develops when the price tests a similar support area twice and rebounds. A move above the intervening high can provide evidence of a potential bullish reversal.
These patterns are more meaningful when the price structure is clear and the breakout is supported by sustained market activity.
Bull Flags and Bear Flags
A bull flag typically develops after a strong upward price movement followed by a short consolidation or modest pullback. Traders monitor whether the price breaks above the consolidation range.
A bear flag follows a sharp decline and forms a temporary consolidation or modest upward retracement. A move below the lower boundary may indicate that selling pressure is continuing.
Flags can fail, particularly when broader market conditions change. Traders should not assume that a pattern will produce a predetermined percentage move.
Bitcoin On-Chain Analysis and Market Sentiment
Although traditional technical analysis focuses on price and trading data, Bitcoin traders sometimes combine it with on-chain analysis. On-chain metrics examine activity recorded on the Bitcoin blockchain and can provide additional insight into network usage and investor behavior.
Examples include transaction activity, exchange balances, miner transfers, and realized-value metrics. However, these indicators require careful interpretation because wallet addresses do not always correspond to individual investors, and transfers do not necessarily indicate immediate buying or selling.
Exchange Inflows and Outflows
Bitcoin exchange inflows measure BTC transferred to exchange addresses, while outflows measure BTC transferred away from them. Large inflows may indicate that more coins are becoming available for potential trading, while sustained outflows can reflect movement into other forms of custody.
Neither metric proves that a transaction will follow. Bitcoin can move between wallets for operational reasons, and exchange custody structures can complicate the interpretation of wallet data.
Fear, Greed, and Investor Sentiment
Market sentiment influences how traders react to new information. Fear can contribute to rapid selling, while excessive optimism can encourage speculative buying and leveraged positions.
Sentiment indicators can help describe prevailing attitudes, but they do not independently predict market direction. Strong bullish sentiment may continue during a rally, while extreme fear can persist throughout a prolonged downturn.
Combining sentiment with support and resistance, volume, and momentum can offer a more complete view of Bitcoin market conditions.
How to Use Bitcoin Technical Analysis in Trading
A structured trading process can help traders apply technical analysis consistently instead of making decisions based on emotion or isolated headlines.
First, identify the broader market trend using a daily or weekly chart. Next, mark relevant support and resistance zones and examine whether price action is trending or consolidating. Traders can then use indicators such as RSI, MACD, or moving averages to assess momentum and seek additional confirmation.
Before entering a trade, define the conditions that would invalidate the trading idea. This may involve a price level, a change in market structure, or another objective condition. Position size should reflect the amount of capital at risk and the distance between the entry price and the planned exit.
For example, a trader considering a breakout above resistance might wait for a candle close above the zone and look for evidence that buying volume is improving. The trader should also consider the possibility of a false breakout and establish an acceptable loss limit before entering.
Backtesting and maintaining a trading journal can help evaluate whether a strategy has performed consistently across different market conditions. Past performance does not guarantee future results, but documenting decisions can reveal recurring mistakes.
Common Bitcoin Technical Analysis Mistakes
One common mistake is using too many indicators. When charts contain numerous overlapping signals, traders may selectively focus on whichever indicator supports their existing opinion. A simpler approach based on price structure, volume, and a small number of complementary indicators may be easier to evaluate.
Another mistake is ignoring the broader economic environment. Bitcoin can react to interest-rate announcements, regulatory changes, ETF developments, and unexpected global events. A chart pattern may become less reliable when significant new information changes market conditions.
Overusing leverage is another serious risk. Because Bitcoin prices can move rapidly, leveraged positions may be liquidated before a trader’s broader market prediction has time to develop.
Finally, traders should avoid treating social media forecasts as verified analysis. Every prediction should be evaluated according to its assumptions, evidence, timeframe, and risk.
Conclusion: Understanding Bitcoin Technical Analysis
Bitcoin technical analysis provides a practical framework for studying BTC price trends, identifying potential support and resistance zones, and evaluating momentum through indicators such as RSI, MACD, moving averages, and Bollinger Bands.
Chart patterns and volume analysis can help traders assess possible breakouts, reversals, and consolidation periods. On-chain data and market sentiment may provide additional context, especially when they agree with the broader price structure.
However, Bitcoin remains a volatile asset, and no technical indicator or chart pattern can guarantee a successful trade. The most responsible approach combines careful analysis, realistic expectations, consistent risk management, and awareness of changing market conditions.
For readers following Bitcoin price analysis, the objective Bitcoin Technical Analysis should not be to predict every market movement. Instead, it should be to understand the available evidence, recognize uncertainty, and make decisions using a clearly defined process.